Tetra Creative Content Database: Insights for Business Development
Tetra Images is a stock content collection of about 225,000 photos and videos. Tetra has approximately 400 contributing artists and 70 distribution partners who license the assets for advertising and editorial uses across the globe. Every month the company collects sales reports from the distributors reflecting thousands of sales transactions at different price points and in different currencies.
The purpose of the Tetra Database is to analyze business performance based on revenue earnings. The design of the ERD and development of queries reveal which assets, which contributors, and which distributors are generating the most revenue. An important metric for the industry is RPI (return per image) as it relates to individual contributors and distribution channels. This information can help the company make decisions about future investments in content production and which distribution channels yield the best results. Because relationships with contributors are an important part of Tetra’s company culture, the database may also allow Tetra to share creative intelligence with individual creators about their most valuable productions.
The data for this project is proprietary and therefore any confidential details are omitted. The database was created using the open source data management system MySQL.
Logical Design
The logical design indicates the entities and their relationships for the database structure. This design step creates the blueprint for creating the database in MySQL
The logical design conveys one-to-many and many-to-many relationships, strong and weak relationships between entities, and relationship degrees.
The Data
Tetra Images’ asset data is available in multiple CSVs. The most challenging areas for handling the data in this structured environment are the keywords and locations which have multiple values in each column and needed to be normalized.
Original CSV data requires normalization.
Asset data loaded into MySQL database
Create statement for ASSET entity.
Normalized data means one keyword per tuple (row).
Queries to Analyze Revenue
The following queries were written in the SQL programming language. Derived attributes, views, transactions, triggers, and complex queries allow the users to identify the most valuable pieces of the business with a granular assessment.
Query to list assets by most number of sales transactions with sum of earnings total.
When a contributor’s RPI (Return Per Image) is higher than the average for all contributors they are labeled “Hot.”
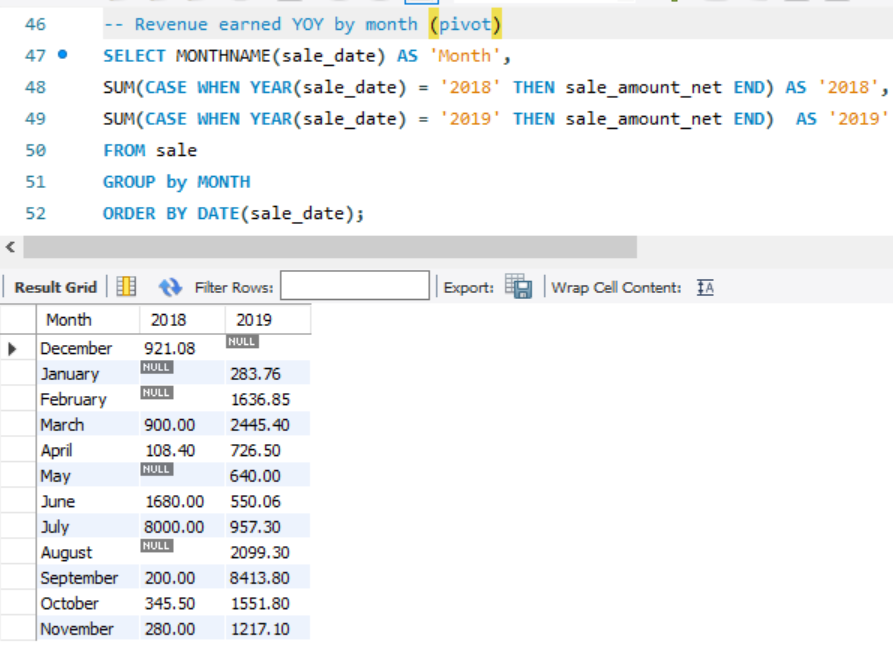
A CASE statement can be used to pivot data to see YOY earnings.
A query to answer what percentage of revenue can be attributed to each distribution partner.
Analyzing sales by keyword. We can compare which images that are labeled “business” have earned the most.


