NYPD Crime Data in Brooklyn: Comparing Parks to Precincts
Prospect Park: Flickr/James Q. Public
How Safe Are Our City Parks vs. Surrounding Precincts?
This research question grew from my personal experience and observations living in Manhattan and Brooklyn. Growing up in New York City I was always told to stay out of the park at night and to avoid going into the park alone at any hour. It was understood that city parks were places of danger and illicit behavior. The common belief was if you went there at night you were likely inviting trouble, or worse. The city’s violent history still seems embedded in our collective impression of our parks today, particularly among older generations of New Yorkers. I live on Prospect Park in Brooklyn now and regularly see joggers and dog owners heading to the park for a run or walk at night. Male or female, together or alone, summer or winter, there are consistently individuals who choose to enjoy the park after hours, and presumably feel safe doing so. Statistically speaking, how big is the risk?
Beginning in 2014 NYPD Classifies Crimes by Park
This research project uses 5 years of NYPD crime complaints data from 2014-2018 to analyze crime rates and trends for two Brooklyn neighborhood parks (Prospect Park and Fort Greene Park) compared to the crime rates and trends for the precincts directly surrounding the two parks. NYPD crime data is available on NYC Open Data. Historic data (2007-2017) and current data (2018) were used for this analysis. In 2014 the NYPD added a “park” attribute to their complaints data. Prior to 2014, crime locations were only identified by precinct. Every park belongs to a precinct. Whether a crime happened in a park, and which one, has allowed a far more accurate study of how much crime is happening in the parks and what types of crimes are most common there. Additional variables used from the data include crime date, crime level, crime description.
Normalizing Data by Population and Area
Fort Greene Park: Flickr/Francisco Daum
Open Street Map with precinct shape file in QGIS
Showing precinct labels in QGIS
Calculating square acreage of parks and precincts in QGIS
Brooklyn area of study: Prospect Park and Fort Greene Park are labeled with initials in the map above, surrounding precincts are identified by number.
Precincts, Population Counts, Acreage
In order to accurately compare crime statistics in the different precincts and parks, population density for each geographic area must be calculated to normalize the crime data. Using open data maps, precinct shape files and calculation tools in QGIS, the square area is derived for each vicinity.
Population numbers were pulled from census block data. Using an online key that maps blocks to New York precincts, population counts may be identified for each precinct. Because the parks do not have resident populations, annual visitor counts were divided by 365 days to create a “population” for each park on an average daily basis.
The Data
NYPD Historic Complaint Data(2006-2017): https://data.cityofnewyork.us/Public-Safety/NYPD-Historic
6.04 million observations, 35 variables
NYPD Current Complaint Data(2018): https://data.cityofnewyork.us/Public-Safety/NYPD-Current
464,000 observations, 35 variables
Cleaning, Grouping, Filtering Data with R
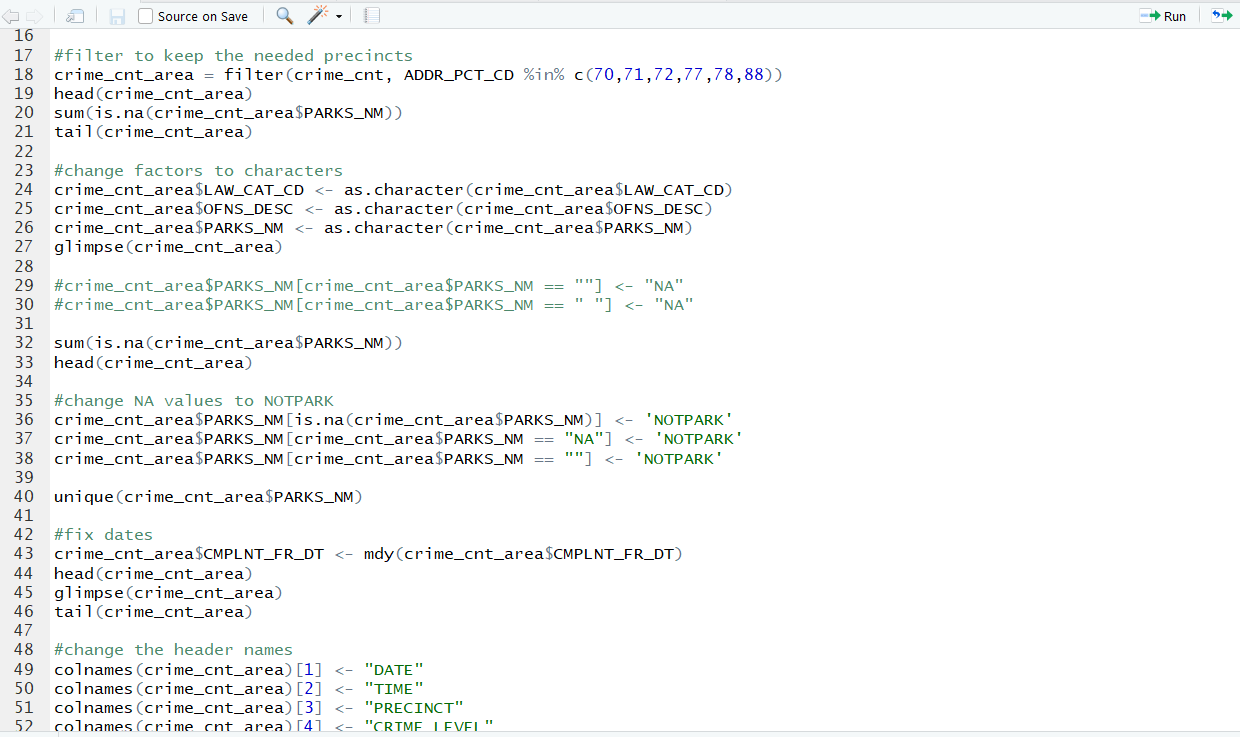
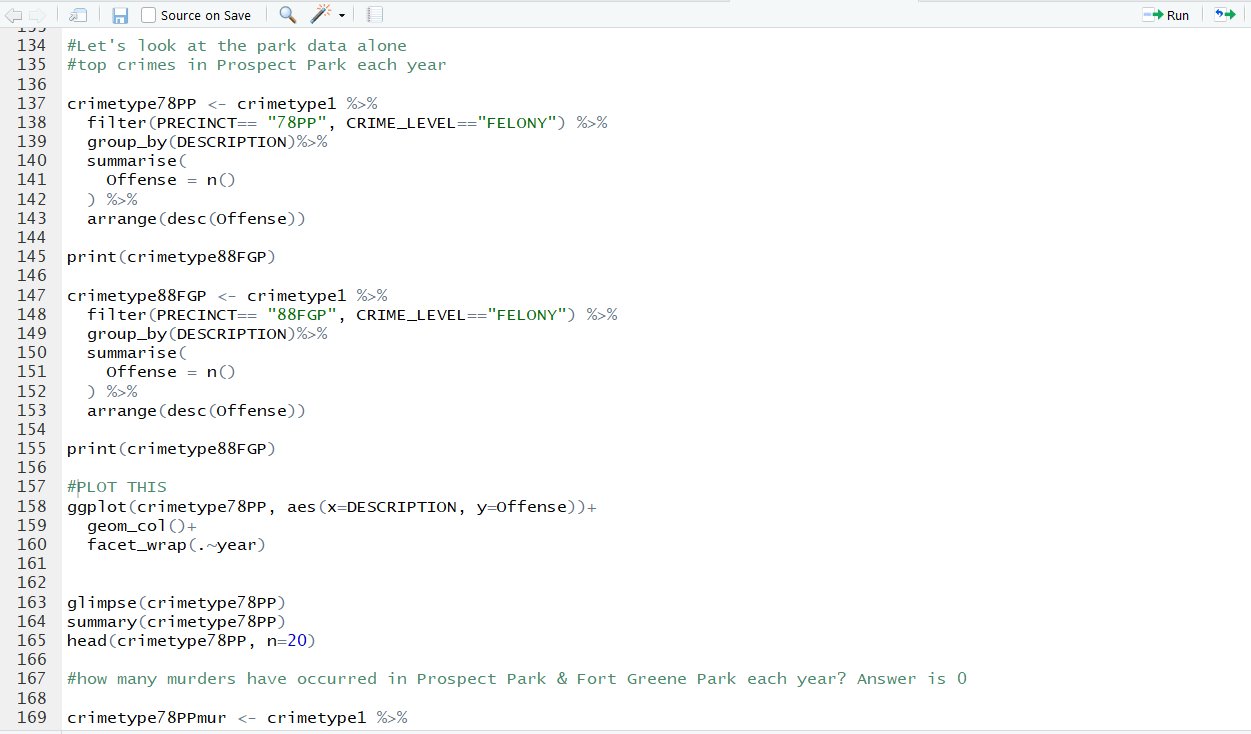
The open data for this project is over 6 million lines across 35 column attributes. The R programming language allows efficient data cleaning and grouping to isolate the desired precincts and parks data for this research question. Combining the data from the censor population counts, R may also be used to calculate the population density for each area and crime averages for years, months, or even hours of the day.
Cleaning data in R
Filtering and grouping in R
Calculations in R
Insights
I investigated many aspects of this data. Times of day of occurrences, crime descriptions, felonies by day/month/year, in-depth analysis of all park crimes that occurred over the 5 years. Below are the most substantial takeaways.
Fewer Crimes Occur in Parks than Precincts
The number of reported crimes in these two parks is much lower than in the surrounding precincts. This graph represents the sum of total reported crimes in each precinct and park.
Precincts show reports of hundreds of crimes per month. The parks only have tens of crimes per month. Some months in the park have shown no felonies reported at all.
Parks Show Lower Crime Rate Too
Crime rates, as calculated using the population density measures, shows that the parks have a far lower rate of misdemeanors and felonies reported.
Precinct (non-parks) upper limits: .00004
Fort Greene Park upper limits: .000005
Prospect Park upper limits: .0000016
Crime rates normalized for population density
Using Tableau to Visualize Findings
Presenting results with R-generated tables is not optimal for broad audience consumption. Therefore, to share the findings of this research project I created a story in Tableau to highlight the most significant analysis results for the 5 year time span.
Visualizing Crime Rates
This graph compares total felony and misdemeanor crimes by population for each of the precincts and each of the parks. The parks have much lower crime rates. We may also observe an overall downward trend in crime for the precincts over the time period.
The lines are labeled with precinct numbers.
Profiling Park Crime by Time of Day
What time of day is safest in these parks? These lines show the sum total of crimes committed in hourly increments. Of interesting note: over these 5 years there has not been one reported felony in Prospect Park between 9:00-10:00 AM. In Fort Greene Park there is an average of just 2 crimes per year between 6:00 AM- 12:00 PM over the same time period.
Which Months Are Most Dangerous in the Parks?
Analyzing the total number of offenses for the parks, grouped by month, we can see that activity is predictably higher during the summer.
Qualitative Analysis: Types of Crimes in Parks
Filtering the data for murder incidents in our areas of interest, we find that no murders have occurred in either of the parks during the five years, whereas each precinct has reported at least one murder each of the years. Most crimes that have occurred in the two parks involve stealing property.
Larceny is stealing where the property-owner is unaware of the theft at the time of the occurrence (ie pickpocketing, car theft, stealing personal property when the owner is distracted or asleep). Larceny does not generate the same level of fear as robbery, which involves confrontation and intimidation by the perpetrator on the victim. Over one-third of all crimes in Prospect Park over the last five years are in the larceny category.
In Prospect Park there have been an average of just over five felony assaults per year. When we consider the estimate of 10 million people flowing through the park in a year, this makes the probability of experiencing this category of violent crime very low for any one person.
When we examine the data as we have done here, our faith may be restored to align with the original purpose for developing and designing the parks as healthy spaces for play, exercise, and refuge in our intense urban environment.
See the Tableau story here.
For further information: all data, methods, and research are available on a Github repository here.


